User Guide for Searching Proteomic Data
Step 1: View Cancer Information:
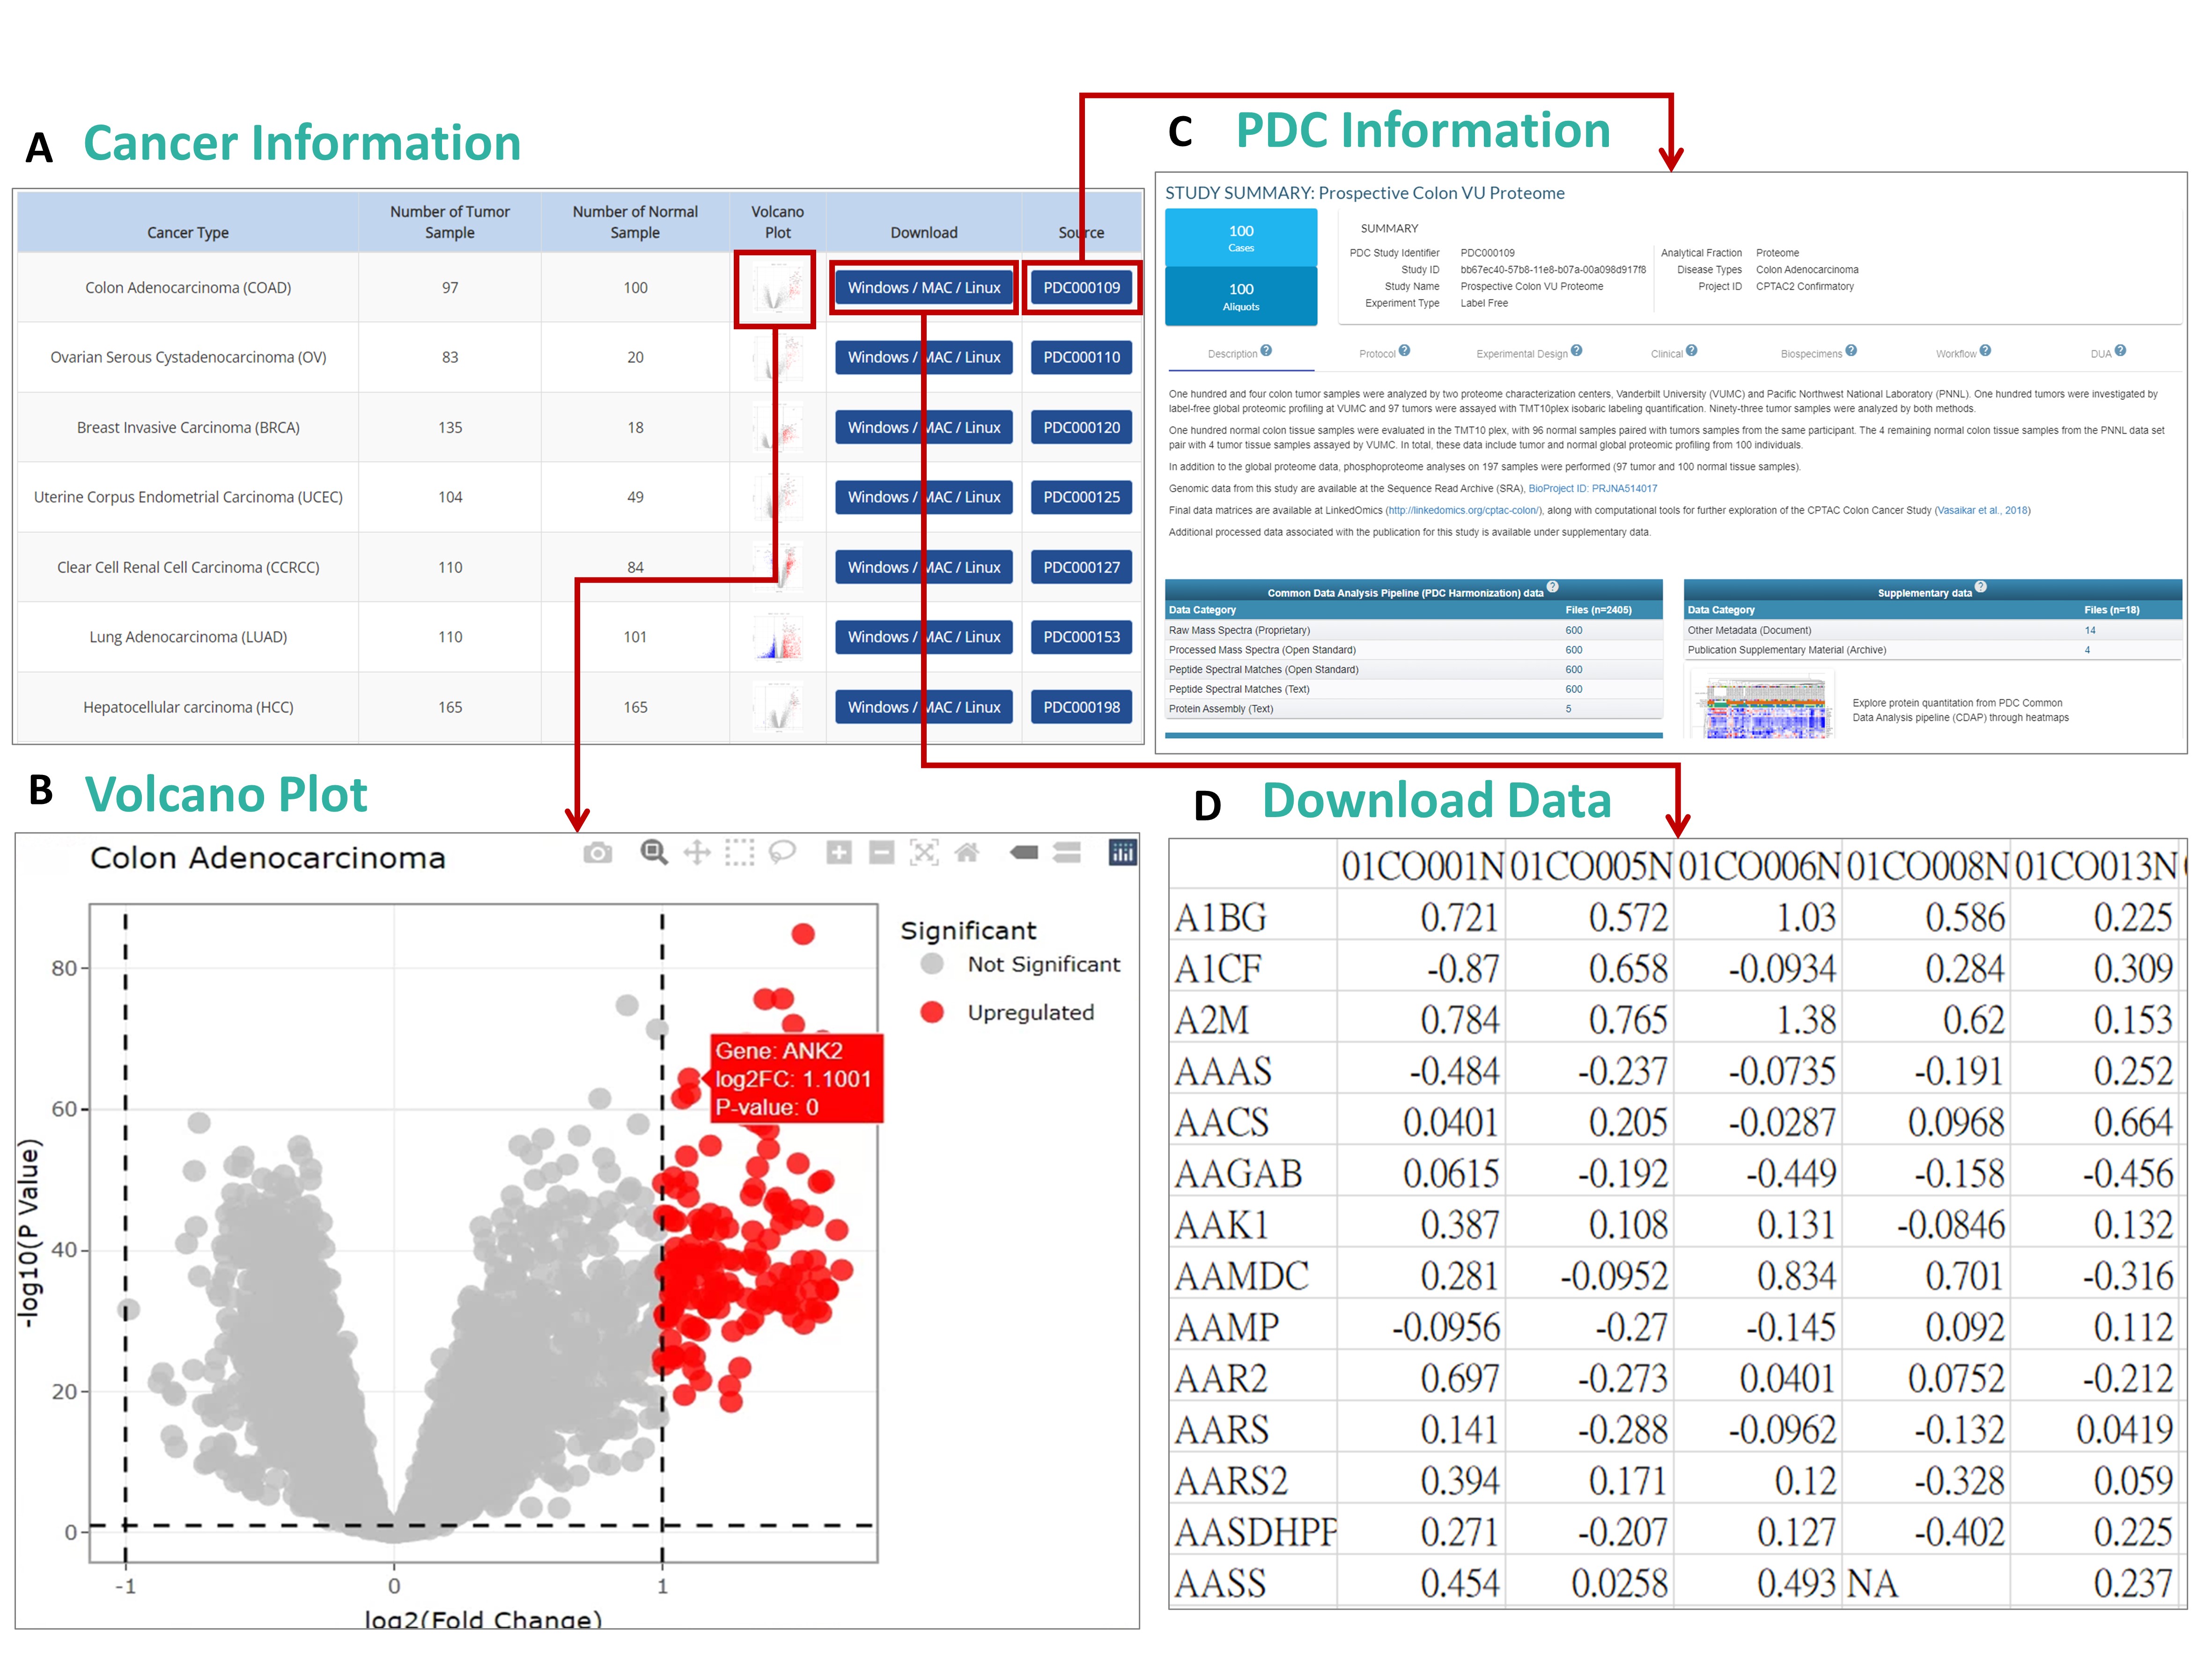
The data portal allows you to browse cancer-specific information, including the number of tumor and normal samples. You can also download related datasets using the download button.
Step 2: Generate Volcano Plot:
To view the statistical significance of gene expressions, click on the volcano plot icon. This will generate a visualization showing upregulated and downregulated genes based on fold-change and p-value.
Step 3: View PDC Information:
The PDC section offers details regarding experimental setup, including the number of samples, analytical methods, and supplementary data for further study.
Step 4: Download Data:
You can download gene expression data directly from the portal. The data is presented in tabular format, making it easy to analyze in software like Excel or R.

User Guide for Browsing Regulatory Network
Step 1: Access the "Browse" Section
Navigate to the
Browse menu in the top navigation bar. Select
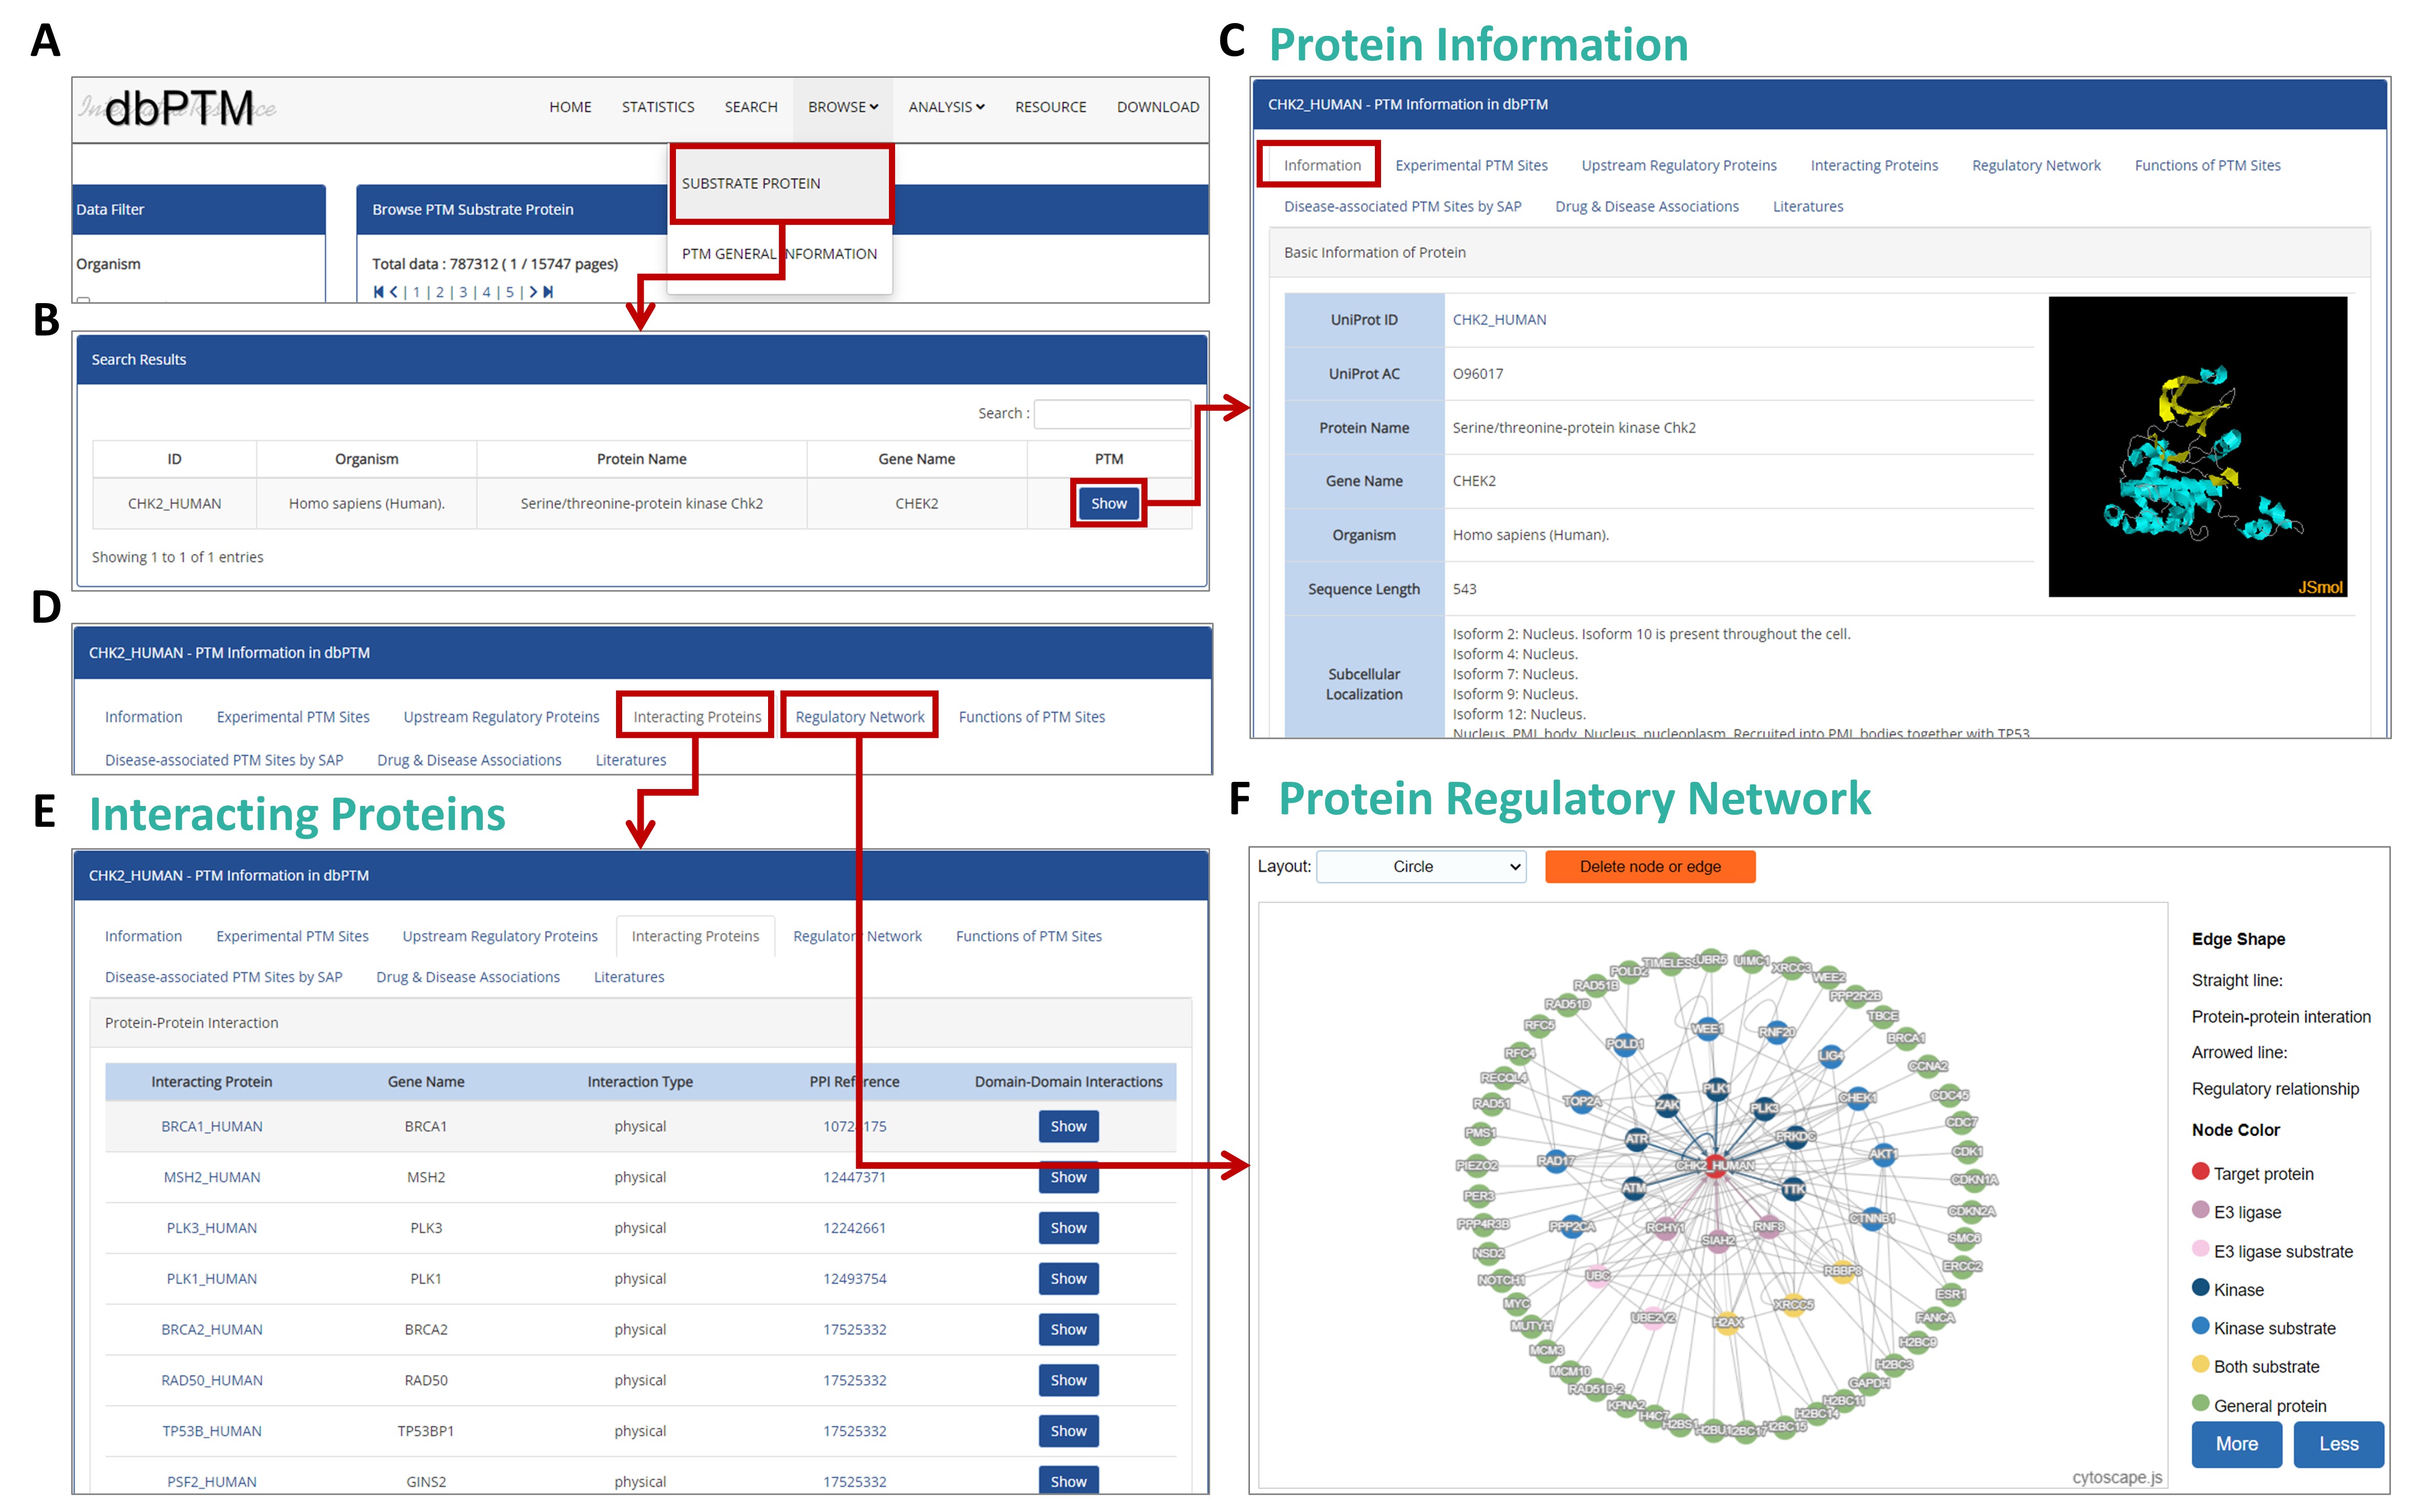
SUBSTRATE PROTEIN to browse PTM substrate proteins.
Step 2: View Protein Information
After selecting a substrate protein category, you will be presented with a list of proteins matching the selected filters. You can narrow down your search based on the organism or other criteria. Once you find the desired protein, click
Show to view more detailed information.
Step 3: Investigate Protein Interactions
On the same page, navigate to the
Interacting Proteins tab to view protein-protein interaction data. You can also click on the
Regulatory Network tab to view the protein's regulatory network, which shows interactions with other proteins, substrates, or E3 ligases.
Step 4: Analyze the Protein Regulatory Network
In the
Regulatory Network tab, you can explore the interactions through a visual network graph. The layout allows you to customize the view (e.g., in a circular layout), showing protein-protein interactions (straight lines) and regulatory relationships (arrowed lines). The node colors distinguish between target proteins, E3 ligases, kinases, and more.

User Guide for Investigating Kinase Activity
Step 1: Select a Cancer Type
In the
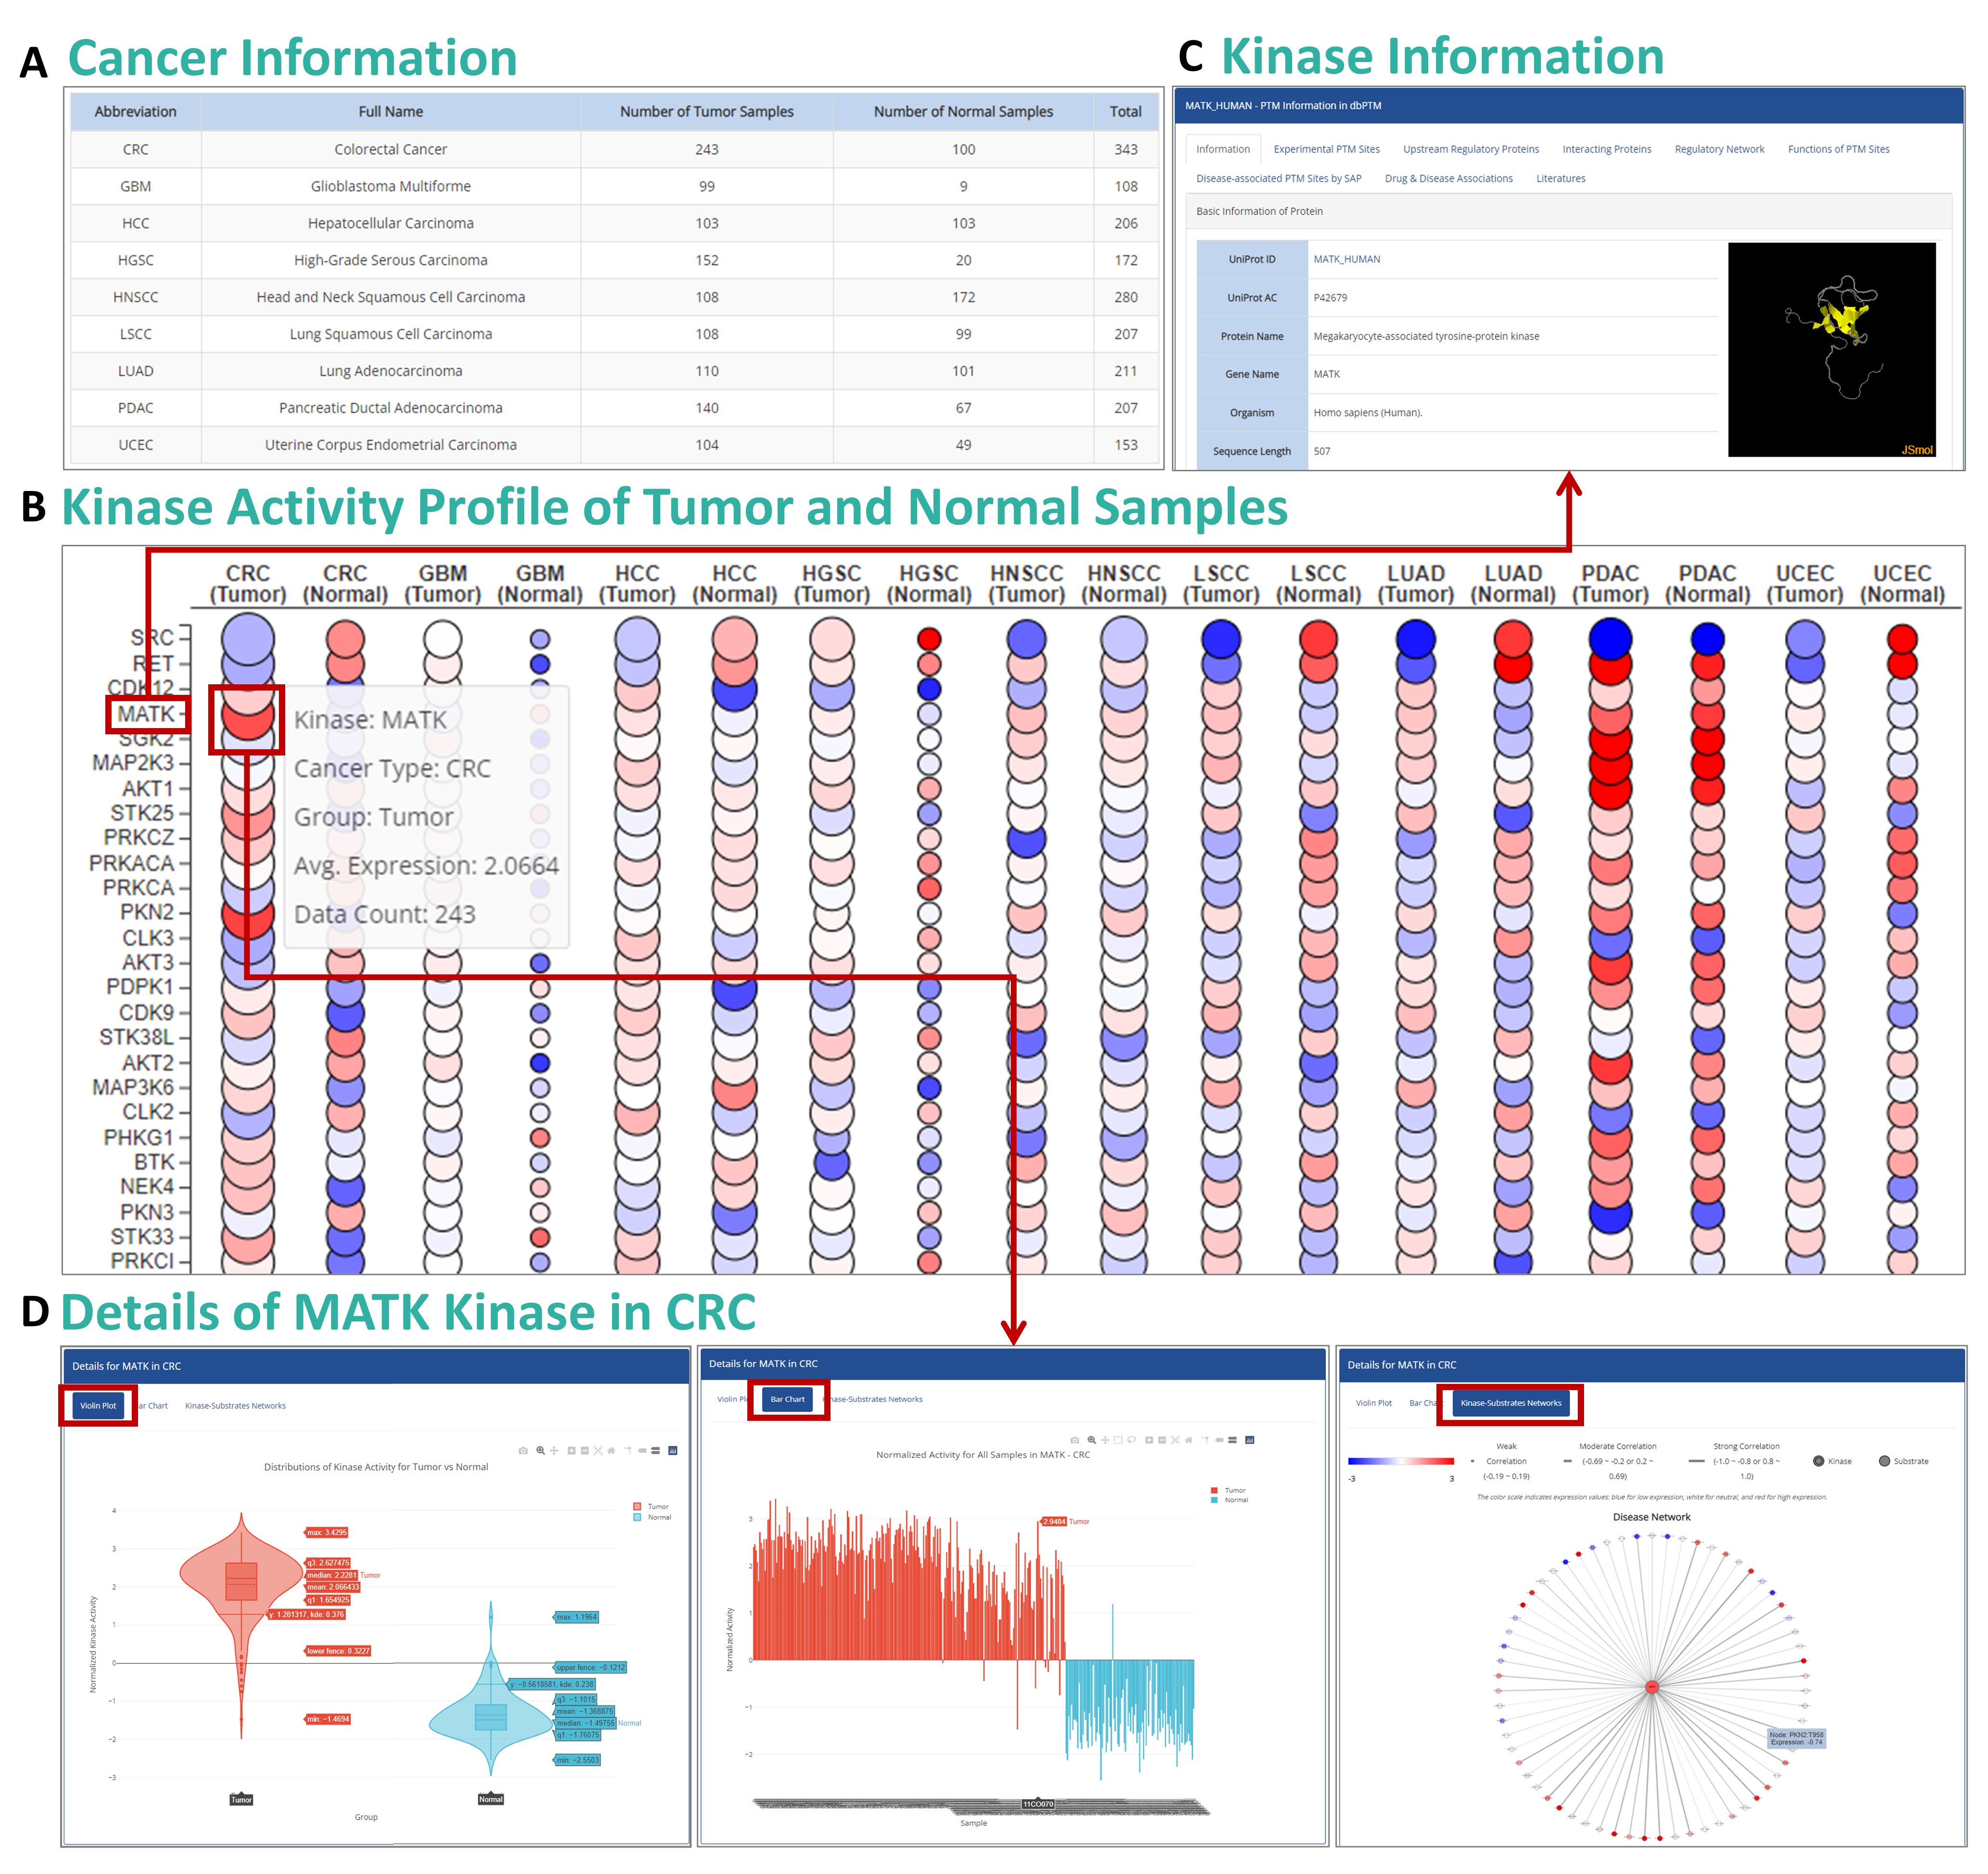
Cancer Information table, select the desired cancer type to view the number of tumor and normal samples. This gives you an overview of available data for that particular cancer.
Step 2: Explore Kinase Activity Profile
The
Kinase Activity Profile visualization displays kinase activity across different samples. The red/blue color coding indicates the level of kinase activity, with red representing higher activity and blue lower activity. Hover over any circle to see detailed information about that kinase, including its expression level and sample count.
Step 3: View Detailed Kinase Information
Clicking on a specific kinase in the profile will bring you to the
Kinase Information section. Here, you will find comprehensive details such as the UniProt ID, regulatory processes, and even a 3D structure of the kinase.
Step 4: Analyze Kinase Activity in Detail
Scroll down to the
Kinase Details section to view specific visualizations, such as violin plots and bar charts. These plots offer a deeper analysis of kinase activity in tumor vs. normal samples, helping you understand its role in specific cancer types.


